TIDE batch
Purpose
- What it does: Estimates the spectrum and frequency of small insertions and deletions (indels) generated in a pool of cells by genome editing tools such as CRISPR/Cas9, TALENs and ZFNs.
- When to use: Quantification of small indels for multiple samples. If you have a single sample, go to the original TIDE site. For templated CRISPR/Cas9 experiments, use the TIDER web tool.
- What it needs: Standard capillary sequencing reactions.
- Drawbacks: The method will not capture megabase long deletions that can originate by CRISPR/Cas9 induced DSB.
- Reference (please cite!): Brinkman et al, Nucl. Acids Res. (2014).
Overview
TIDE provides rapid and reliable assessment of genome editing experiments of a target locus. Based on the quantitative sequence trace data from two standard capillary sequencing reactions the TIDE software quantifies the editing efficacy and identifies the predominant types of insertions and deletions (indels) in the DNA of a targeted cell pool.
The input to TIDE is Sanger sequencing data.
The output of TIDE is a comprehensive profile of all insertions and deletions (indels) in the edited sample.
License, terms of use, policies and code
- The TIDE software is being provided as a free web service for research, educational, instructional and non-commercial purposes only.
- When using the TIDE software this Privacy Policy and these Terms and Conditions apply.
- If you use this software for data analysis in a publication, please cite Brinkman et al, Nucl. Acids Res. (2014).
- The R code of the TIDE algorithm is available upon request.
- Support is given by Data Curators VOF, see our Best Effort Support Policy .
- All copyright is exclusively owned by Stichting het Nederlands Kanker Instituut - Antoni van Leeuwenhoek ziekenhuis (The Netherlands Cancer Institute).
Contact
This web tool was developed by Eva Brinkman, Tao Chen and Bas van Steensel from the Bas van Steensel lab.
For more information and to report bugs, please contact support@datacurators.nl
Acknowledgements
R
R Core Team (2013). R: A language and environment for statistical computing. R Foundation for Statistical Computing, Vienna, Austria. www.R-project.org . R version 3.1.1.
Biostrings
H. Pages, P. Aboyoun, R. Gentleman and S. DebRoy. Biostrings: String objects representing biological sequences, and matching algorithms. R package version 2.32.1.
sangerseqR
J.T. Hill and B. Demarest (2014). sangerseqR: Tools for Sanger Sequencing Data in R. R package version 1.3.1. http://www.bioconductor.org/packages/devel/bioc/html/sangerseqR.html
nnls
K. M. Mullen and I. H. M. van Stokkum. The Lawson-Hanson algorithm for non-negative least squares (NNLS). R package version 1.4.
shiny
RStudio and Inc. (2013). shiny: Web Application Framework for R. R package version 0.11.1. http://CRAN.R-project.org/package=shiny
Instructions
1. Upload Data:
- Enter a 20nt ('5-'3) DNA character string representing the used sgRNA guides sequence immediately upstream of the PAM sequence (PAM not included). Numbers and other invalid (non-IUPAC) DNA characters will be automatically removed. TIDE assumes that a dsDNA break is induced between nucleotides 17 and 18 in the sgRNA sequence.
- Upload the chromatogram sequence files of respectively the control samples (e.g. transfected without Cas9 or without the sgRNA) and the test samples (e.g. DNA of pool of cells treated with both Cas9 and the sgRNA). Upload always the same amount of control as test samples.
We advise to sequence a stretch of DNA ~700bp enclosing the designed editing site. The projected break site should be located preferably ~200bp downstream from the sequencing start site. This region upstream of the break site is used to align the sequencing data of the test sample with that of the control sample.
Batch: You can upload one guide and one control file together with multiple test samples or upload the same amount of guide, control and test samples. For control and test sample, select multiple .ab1 or .scf files during uploading. One can select multiple files in the file browsing window by cmd-click (mac) or ctr-click (windows). For the guide list, separate the sequences with a ;. Note: the files and sgRNA sequences must be uploaded in corresponding order.
Currently, ABIF (.ab1) and SCF (.scf) files are supported. SCF is an open standard and several tools exist to convert other formats to SCF files.
2. Enter Parameters for Analysis:
The following parameters have default settings but can be adjusted if necessary in the panel to the left by checking the 'advance settings' box.
Alignment window
These settings determine the window in which the control and test sequences are aligned to determine any offset between the two reads. There is usually no need to deviate from the default settings, except when long repetitive sequences are present.
left boundary:
By default this is set to 100, because base-calling at the start of a Sanger sequence read is often of poor quality.
right boundary:
This is automatically set at break site - 10bp
Decomposition window
These settings determine the sequence segment used for decomposition. The decomposition window is set on a sequence segment downstream of the break site. The default setting is the largest window possible for the uploaded sequences. In general, the larger the decomposition window is chosen, the more robust the estimation of mutations is.
left boundary:
max indel size + 5bp downstream of the break site.
right boundary:
max indel size + 5bp before the end of the shortest sequence read.
Indel size range
Set the maximum size of deletions and insertions to be modeled. The default value is 10.
P-value threshold
Significance cutoff. Any value between 0 and 1 is accepted. Default is p < 0.001
3. Results:
Once the data are uploaded and parameters are set, submit the data by clicking on the "update view" button and the uploaded samples appear in the ???Uploads??? tab. Here you can check if the guide sequence, control file and test files are correctly matched. Also potential errors if particular files will be noted. The plots can be downloaded in the: "Download" tab. If the settings are incorrect or too stringent, warnings or remarks will be displayed in the file.
Indel spectrum plot
A depiction of the combination of trace models (indels) that can best explain the composite sequence trace in the experimental sample as determined by non-negative linear modelling. An R2 value is calculated as a measure of the goodness of fit, and the statistical significance of the detection of each indel is calculated.
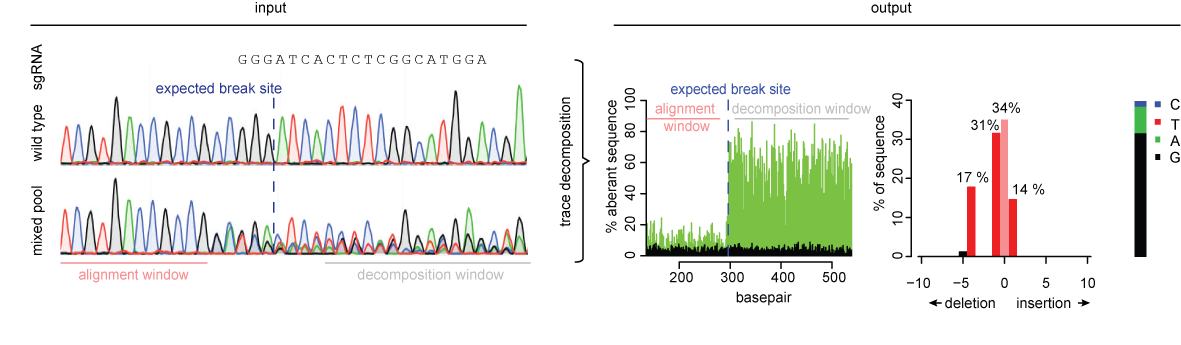
Aberrant sequence signal plot
The signals of all nucleotides: A, G, T, C at each position in the sequence file are used. In general, each position in the sequence trace is represented by one predominant nucleotide signal indicative of the actual nucleotide. The minor signals from the other three nucleotides are normally considered as background. The percentage of these aberrant nucleotides is plotted along the sequence trace of the control and the experimental sample.
Thus, a value of 0% at a position indicates that the detected nucleotide does not differ from the control sequence while a value of 100% indicates that the expected nucleotide was not detected at all (and instead only one or more of the other three nucleotides). The percentages of aberrant nucleotides in the control should be low along the whole sequence trace. However, the experimental sample consists of a mixture of multiple sequences due to the presence of indels and possible point mutations. Around the break site the sequences start to deviate from the control, which is visible with consistently elevated signal of the aberrant sequence signal. Note that there is a 25% chance that an identical nucleotide in a mutated sequence is found as is present in the control sequence at the same position, because there are only 4 different nucleotides available.
Quality measures: Results depend on the quality of the sequence reads. As a rule of thumb, we recommend to aim for an average aberrant sequence signal strength before the breaksite < 10% (both control and test sample), and R2 > 0.9 for the decomposition result. Sequencing of the opposite strand is recommended to confirm the results.
+1 insertion plot
An estimate of the base composition of this insertion.
Data can be downloaded when the valid sequencing files and guide string have been uploaded.
Index
See Brinkman E.K., van Steensel B., CRISPR Gene Editing. Methods in Molecular Biology, vol 1961. (2019) for a detailed explanation of protocol and troubleshooting examples.FAQ
- What is the minimal sequence length you need?
- What happens if the sequence is shorter than 700 bp?
- Does the break site really need to be 200 bp away from the primers?
- How is the overall efficiency calculated?
- What do the different indel bars indicate when cell pool was sequenced?
- What do the different indel bars indicate when cell clone was sequenced?
- Can we get the sequence of different indels?
- Can TIDE be used for other nucleases (e.g. TALEN, ZFN, other RNA guided nucleases with different PAM)?
Troubleshooting
- Webtool does not respond when uploading .ab1 files
- Wrongly annotated nucleotides
- Low R2 value
- Forward and reverse indel spectra are not identical
- No sgRNA match because there is a mismatch in the control sequence
- Error boundaries of decomposed region are not acceptable
- Poor alignment
FAQ
What is the minimal sequence length you need?
The requirements of sequence length are flexible. This region upstream of the break site is used to align the sequencing data of the test sample with that of the control sample. The region behind the break site is used for a decomposition to determine the various indels in the pool of cells. In general, with a bigger stretch of sequence trace a better estimation can be performed by TIDE. We advise to sequence a stretch of DNA ~700bp enclosing the designed editing site. The projected break site should be located preferably ~200bp downstream from the sequencing start site.
What happens if the sequence is shorter than 700 bp?
TIDE should work with shorter sequences if the quality of the sequence reads is good. In that case the start of sequence read (alignment window) might have to be set lower than the default setting of 100. Often with shorter sequences the break site is too close to the start of the sequence read in the default setting (see figure). The alignment window can be changed under Advanced settings.
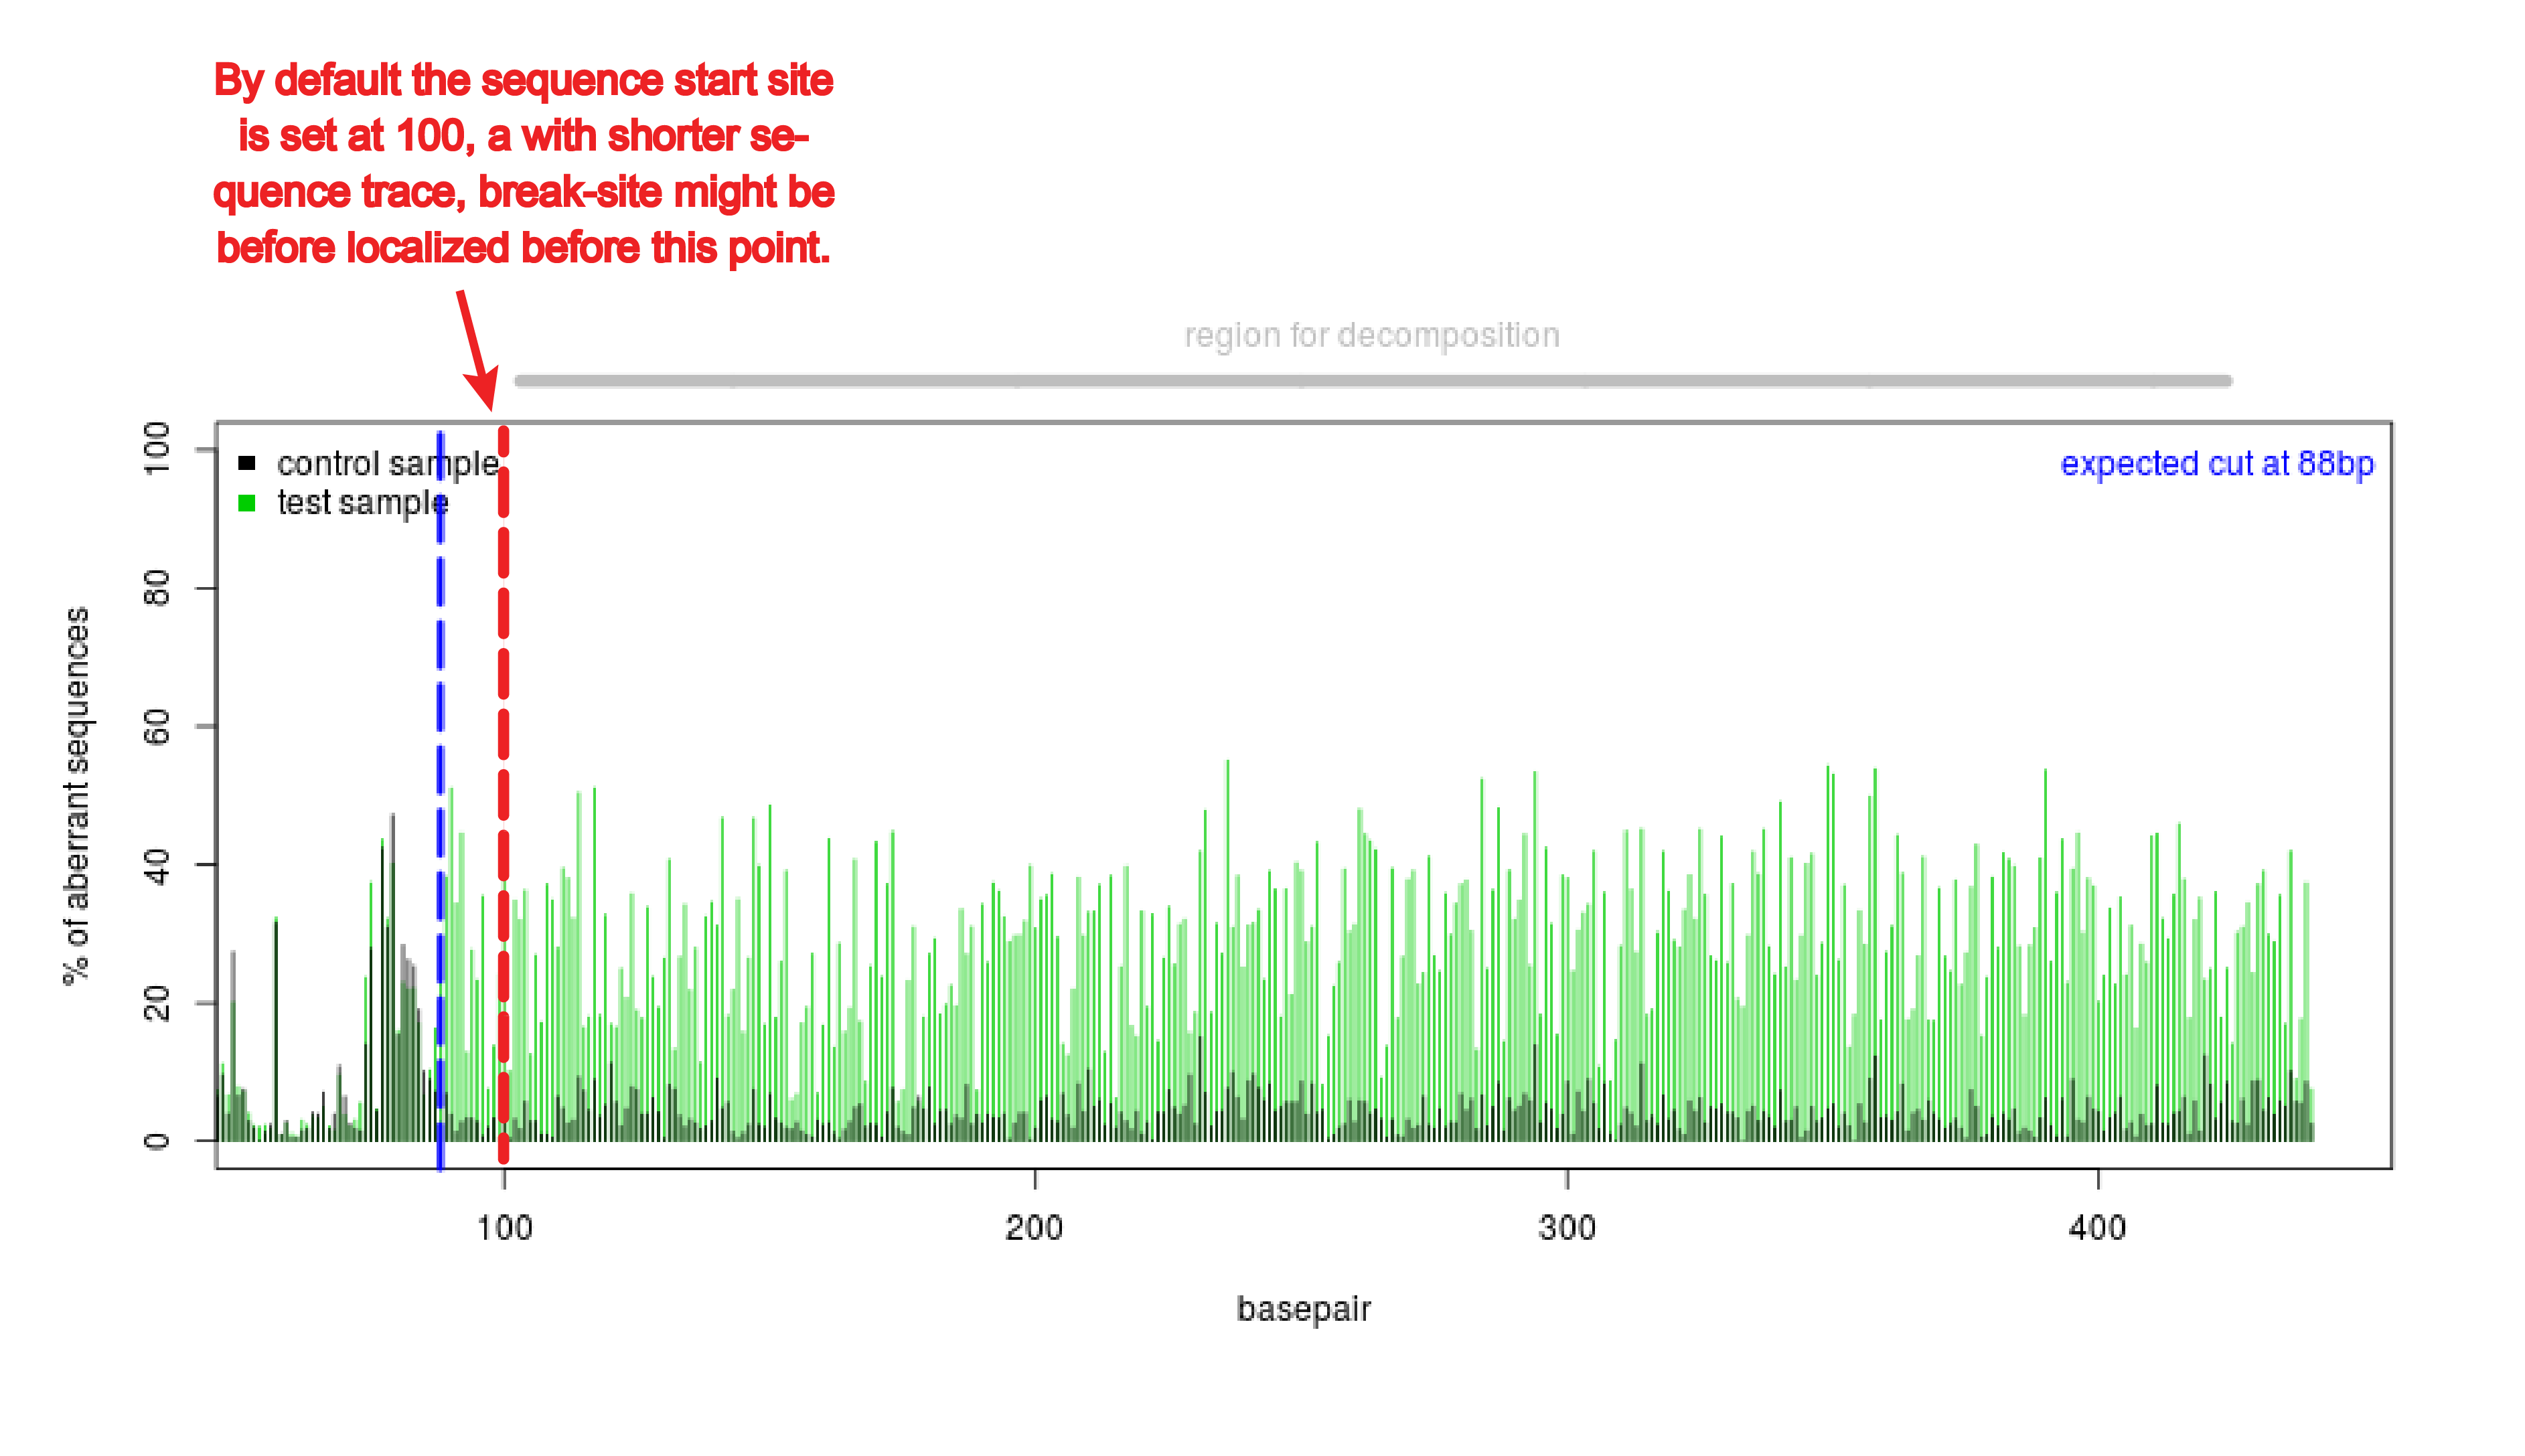
Does the break site really need to be 200 bp away from the primers?
TIDE should work with sequences with a break site closer or further than 200 bp to the start of the sequence trace if the quality of the sequence reads is good. In that case of break site closer to beginning, the start of sequence read (alignment window) have to be set lower than the default setting of 100. The break site is too close to the start of the sequence read in the default setting to perform an alignment (see figure). The alignment window can be changed under Advanced settings. In case of break site further from the beginning, the decomposition window become smaller. Note, a larger stretch of nucleotides selected often makes the estimation of the indels more reliable. The minimal decomposition window spans from 2x n bp indel size & it has to be at least 5bp from the sgRNA target site or the end of the sequence.
How is the overall efficiency calculated?
The overall efficiency doesn't need to add up to 100%, because there is also noise in the data.
The overall efficiency is calculated as R2 - % wildtype (zero indels). For example if the R2 value is 0.95, it tells that 95% of the variance can be explained by the model; the remainder 5% is noise or very large indels.
What do the different indel bars indicate when cell pool was sequenced?
The different indel bars represent the different insertion and deletions in the population. You can’t tell for an individual cell what the specific indels of each allel is. To determine allel specific information you have to isolate a cell clone and perform TIDE analysis.
What do the different indel bars indicate when cell clone was sequenced?
The different indel bars represent the different insertion and deletions in the allels in a cell clone. With a diploid cell you should get a percentage of ~50% per indel.
Can we get the sequence of different indels?
The sequences of the specific indels cannot be deduced from the sequence trace. We tested this option, but Sanger sequening is not sensitive enough to give reliable results on this. To know the precise sequence of the mutations you can use next generation sequencing or sequencing the DNA of individual mutated clones.
Can TIDE be used for other nucleases (e.g. TALEN, ZFN, other RNA guided nucleases with different PAM)?
You can use TIDE for other RNA guided nucleases by entering in the TIDE webtool the DNA sequence around the expected cut site. TIDE assumes that a dsDNA break is induced between nucleotides 17 and 18 in the input sequence. You can estimate which sequence this will be for the other nucleases. Note that if you don’t know the exact breakpoint, TIDE should work fine to estimate the efficiency, but the +1 estimation is not be reliable anymore.
Troubleshooting
Webtool does not respond when uploading .ab1 files
At the moment some .ab1 sequence files are not compatible with the TIDE webtool. Various software programs that process the raw sequence data can cause this problem. We are working on this issue. For now, we recommend that you export the data as a .scf file and then uploaded in TIDE. The .ab1 format can also be converted to .scf using software such as 4peaks (Mac) or FinchTV (Windows & Mac).
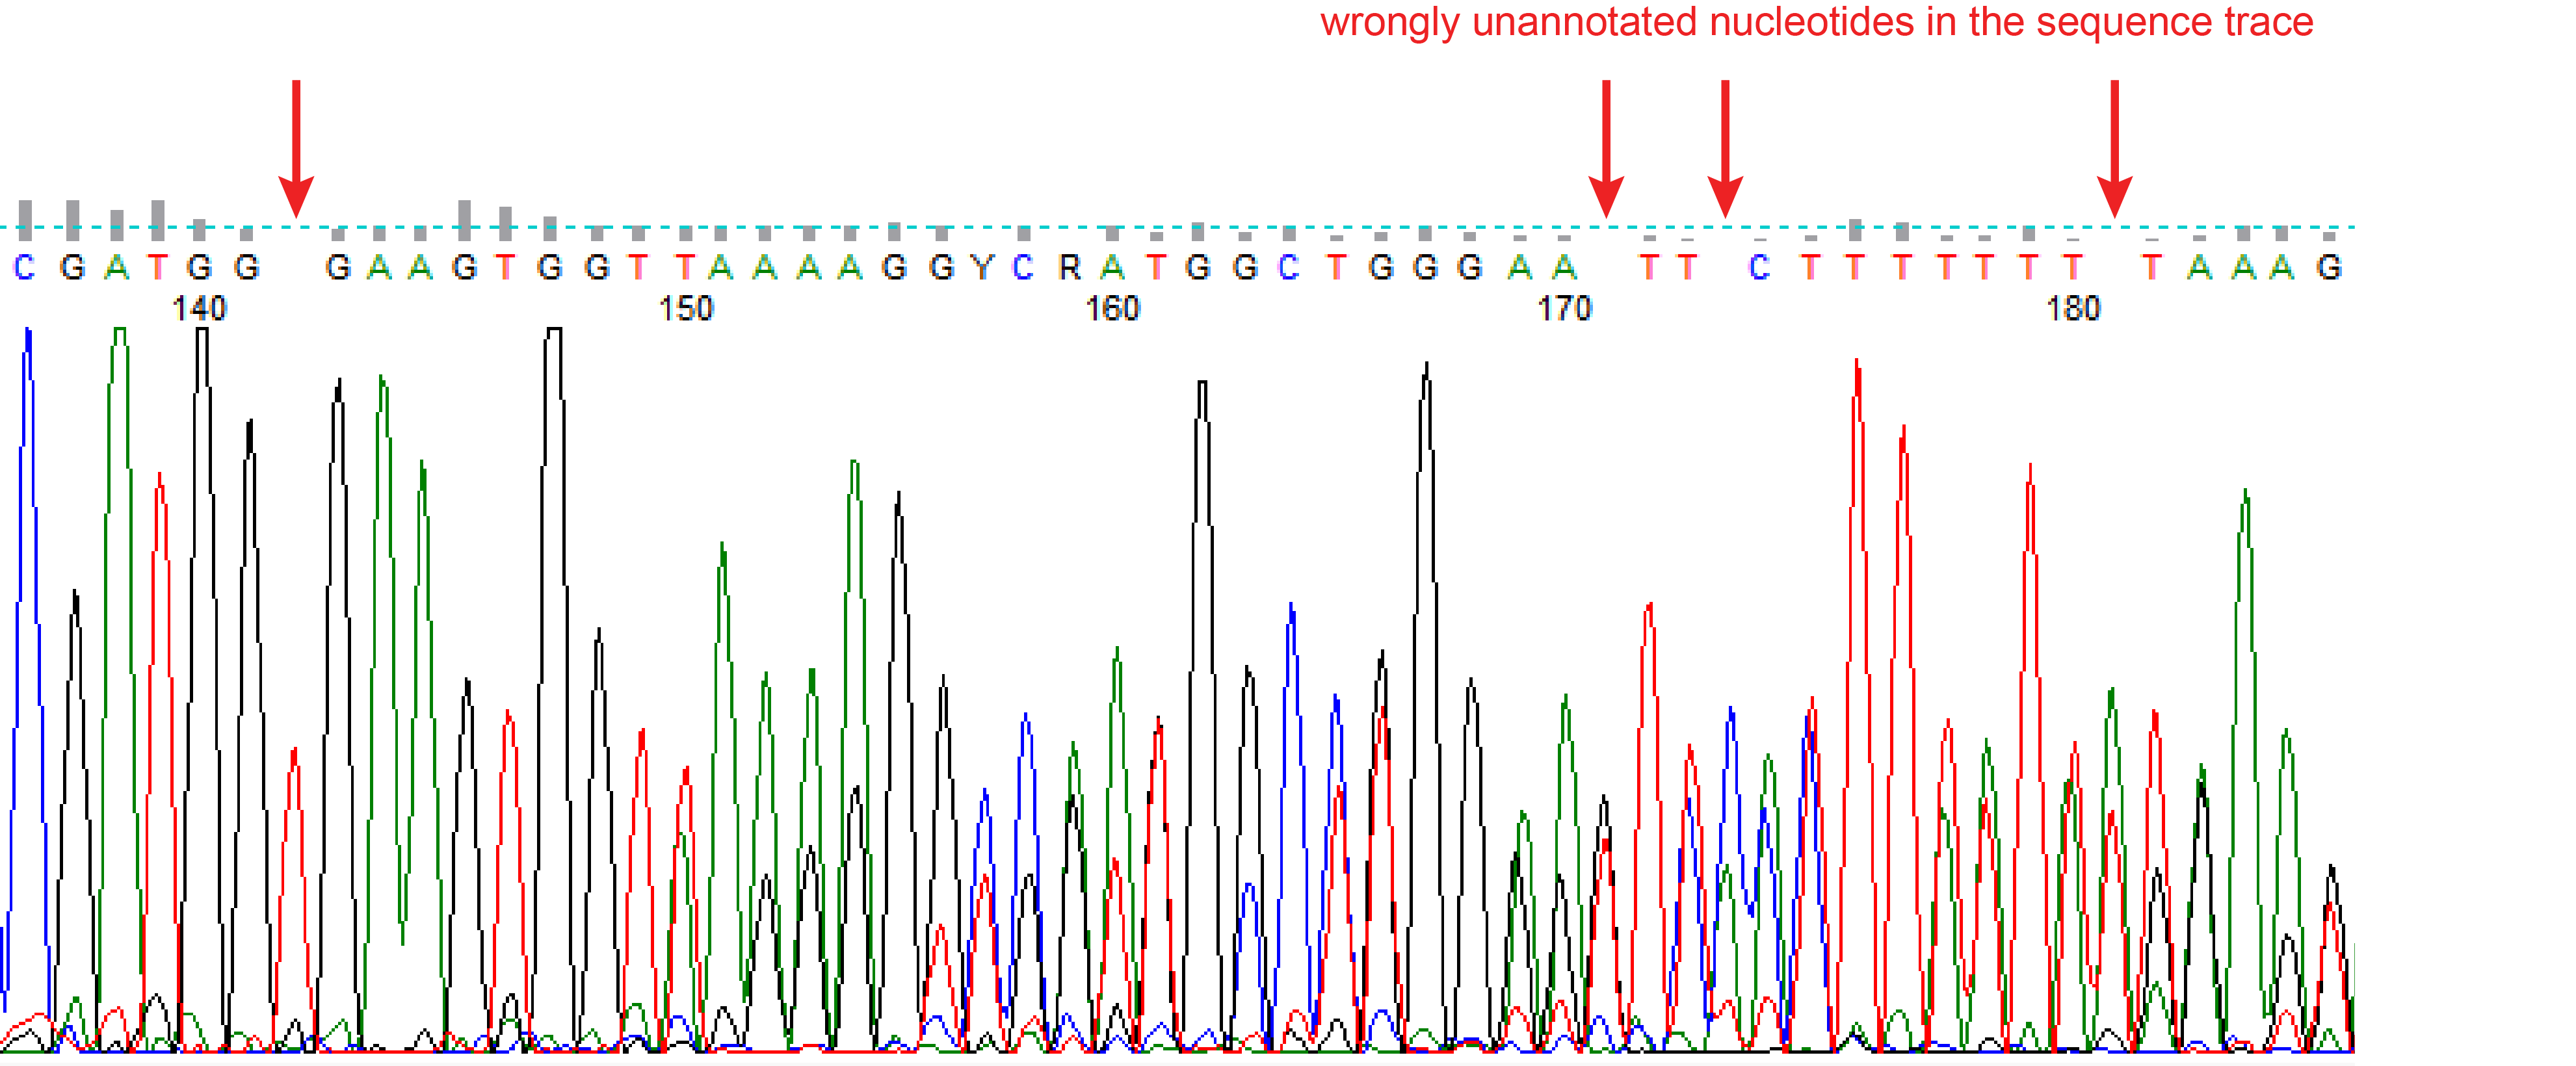
Wrongly annotated nucleotides
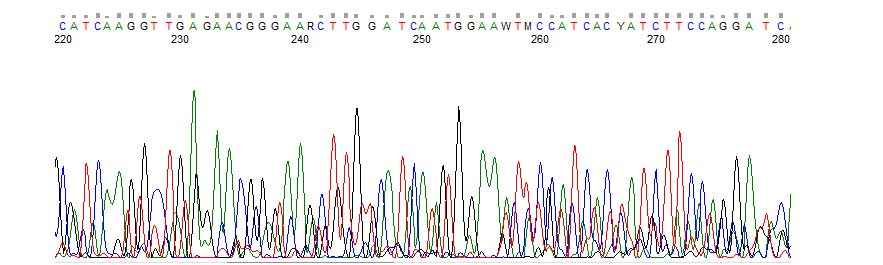
Sometimes the quality of the peaks in chromatogram looks fine, but the file has some wrongly unannotated or wrongly additional annotated nucleotides. These will interfere with the indel spectra (see figure wrongly unannotated nucleotide). TIDE gives a warning when the spacing between the nucleotides in the chromatogram of the sequence trace are not consistent, which is often an indication for wrongly unannotated or wrongly additional annotated nucleotides. Then the sequence file cannot be used for a reliable TIDE analysis. Try if possible to set the right boundary of the decomposition window lower. In case this warning stays, carefully investigate your chromatogram.
Low R2 value
A low R2 can be caused when the settings are not optimal or when the sequence quality is not good.
Settings
By default, the decomposition window is set to its maximum size and the Indel size range is set to 10. The settings can be adjusted in advanced settings.
- Large indels are present in the sample. By default the decomposition is calculated with a maximal indel size of 10. When larger indels are present, they will cannot be modeled, which will result in a low R2. Try to increase the Indel size range to test if this improves the fit (see figure Indel size range)
- Poor local quality of the sequence trace. Often the end of the sequence is of low quality. This can be observed in the quality plot that shows a high aberrant sequence signal at the end of the sequence trace (see figure Poor quality sequence end). This compromises the decomposition of the sequence trace. Adjust the boundaries of the decomposition window in such a way that it will not overlap with the region that is of low quality.
- Repetitive regions in the sequence trace. These regions can be observed in the quality plot as a sudden stretch without aberrant nucleotides (see figure Repetitive region). This region might interfere with the decomposition of the sequence trace. Adjust the boundaries of the decomposition window in such a way that it will not overlap with the repetitive sequence part.
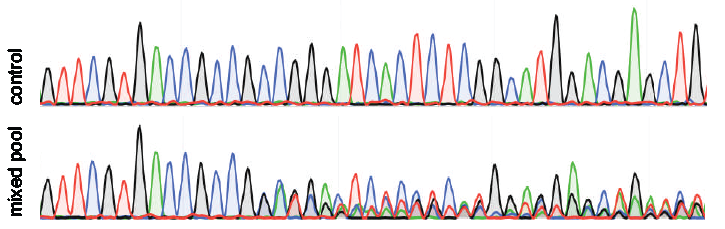
Poor sequence quality can be observed in chromatogram (see figure Poor sequence quality). There is more noise present in the data with results in a lower R2.
Figure: Indel size range
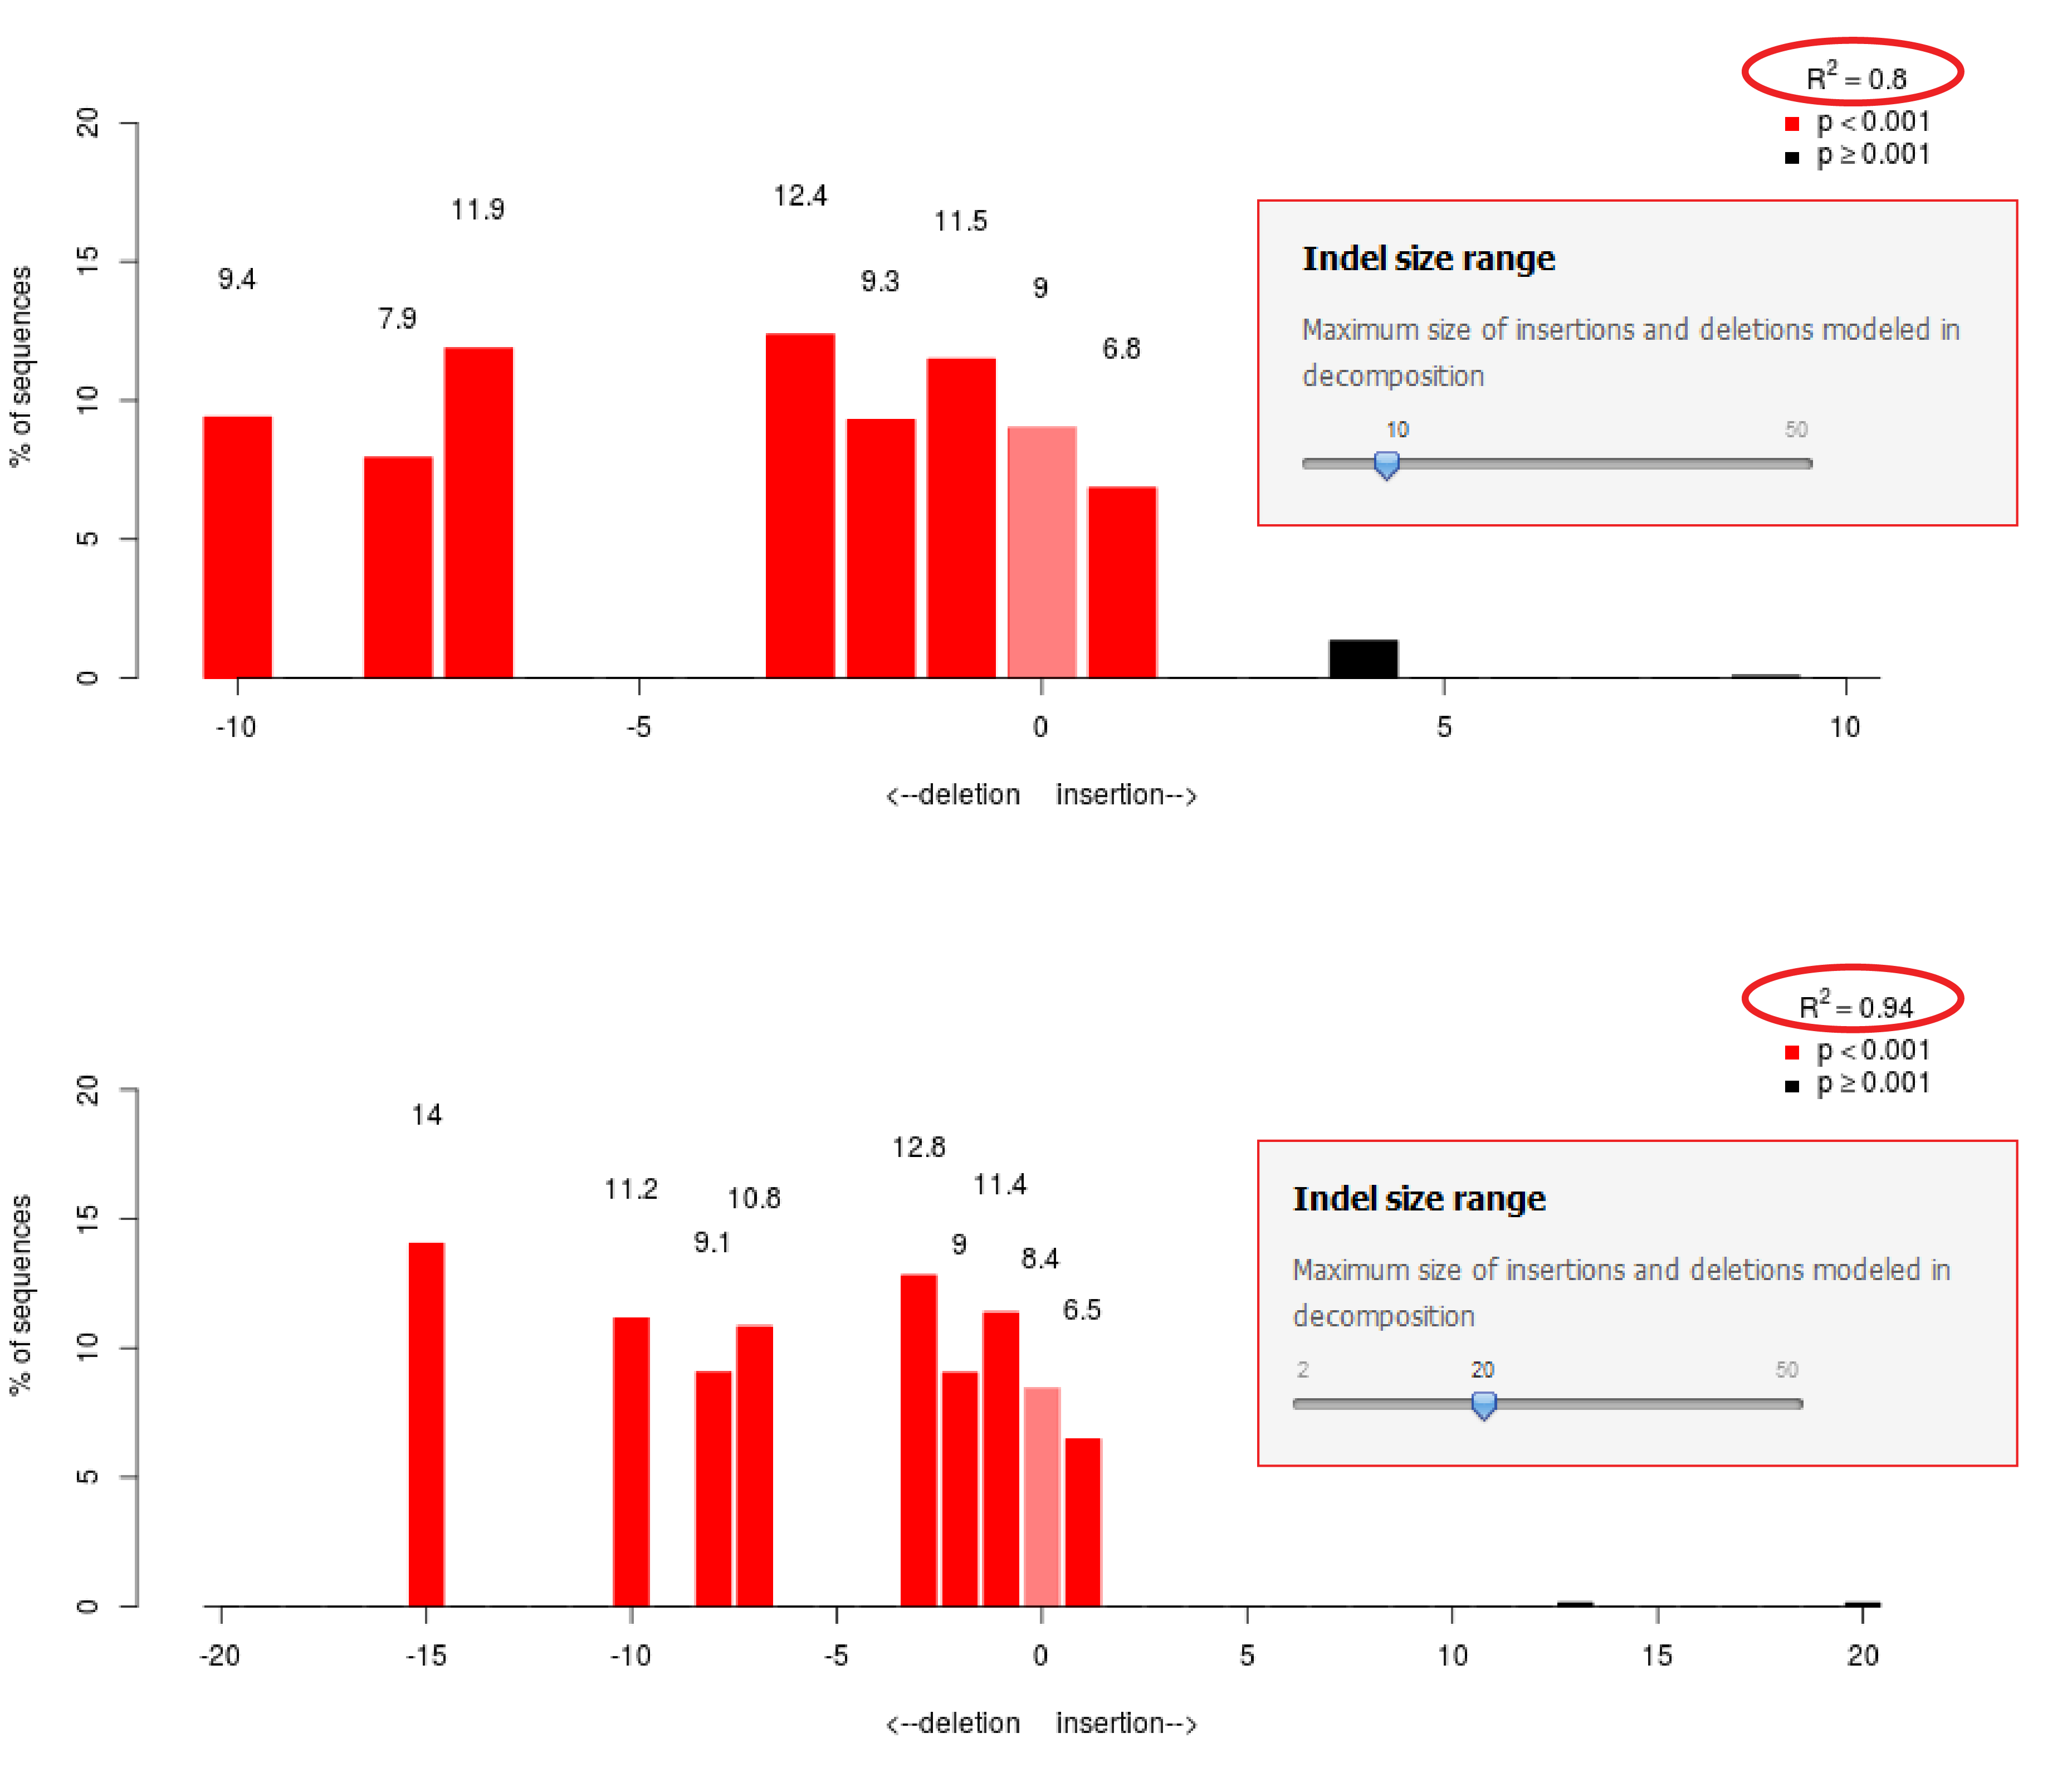
Figure: Poor quality sequence end
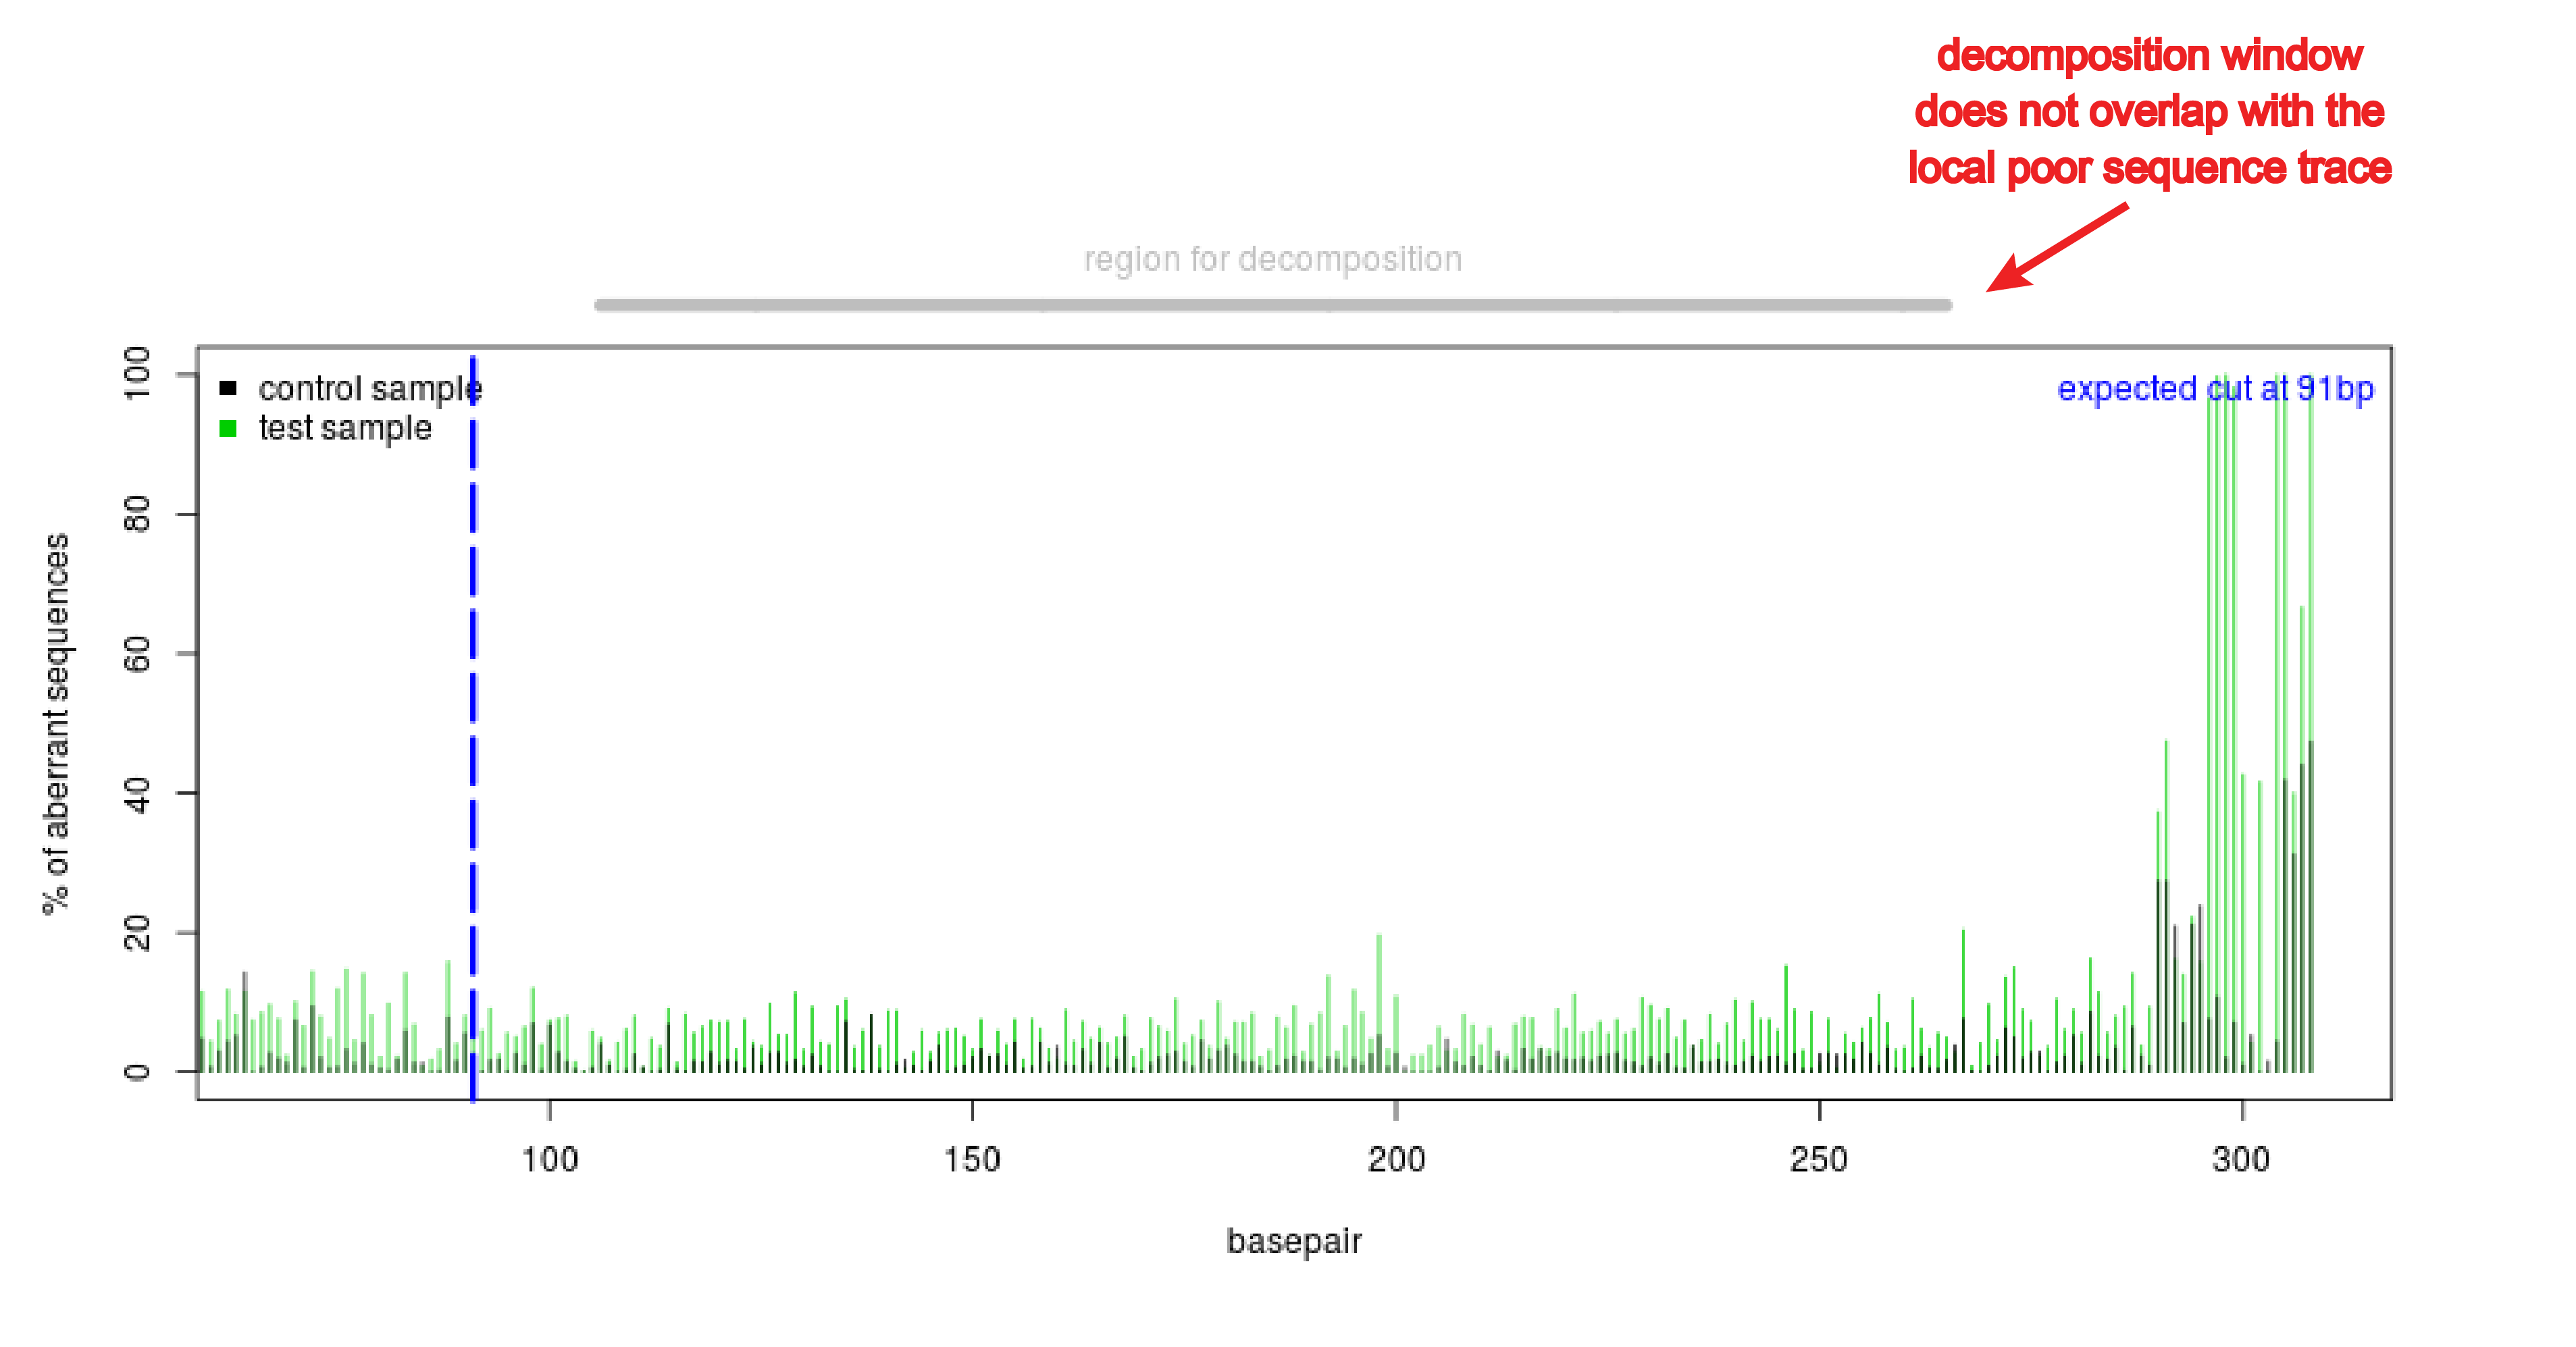
Figure Repetitive region
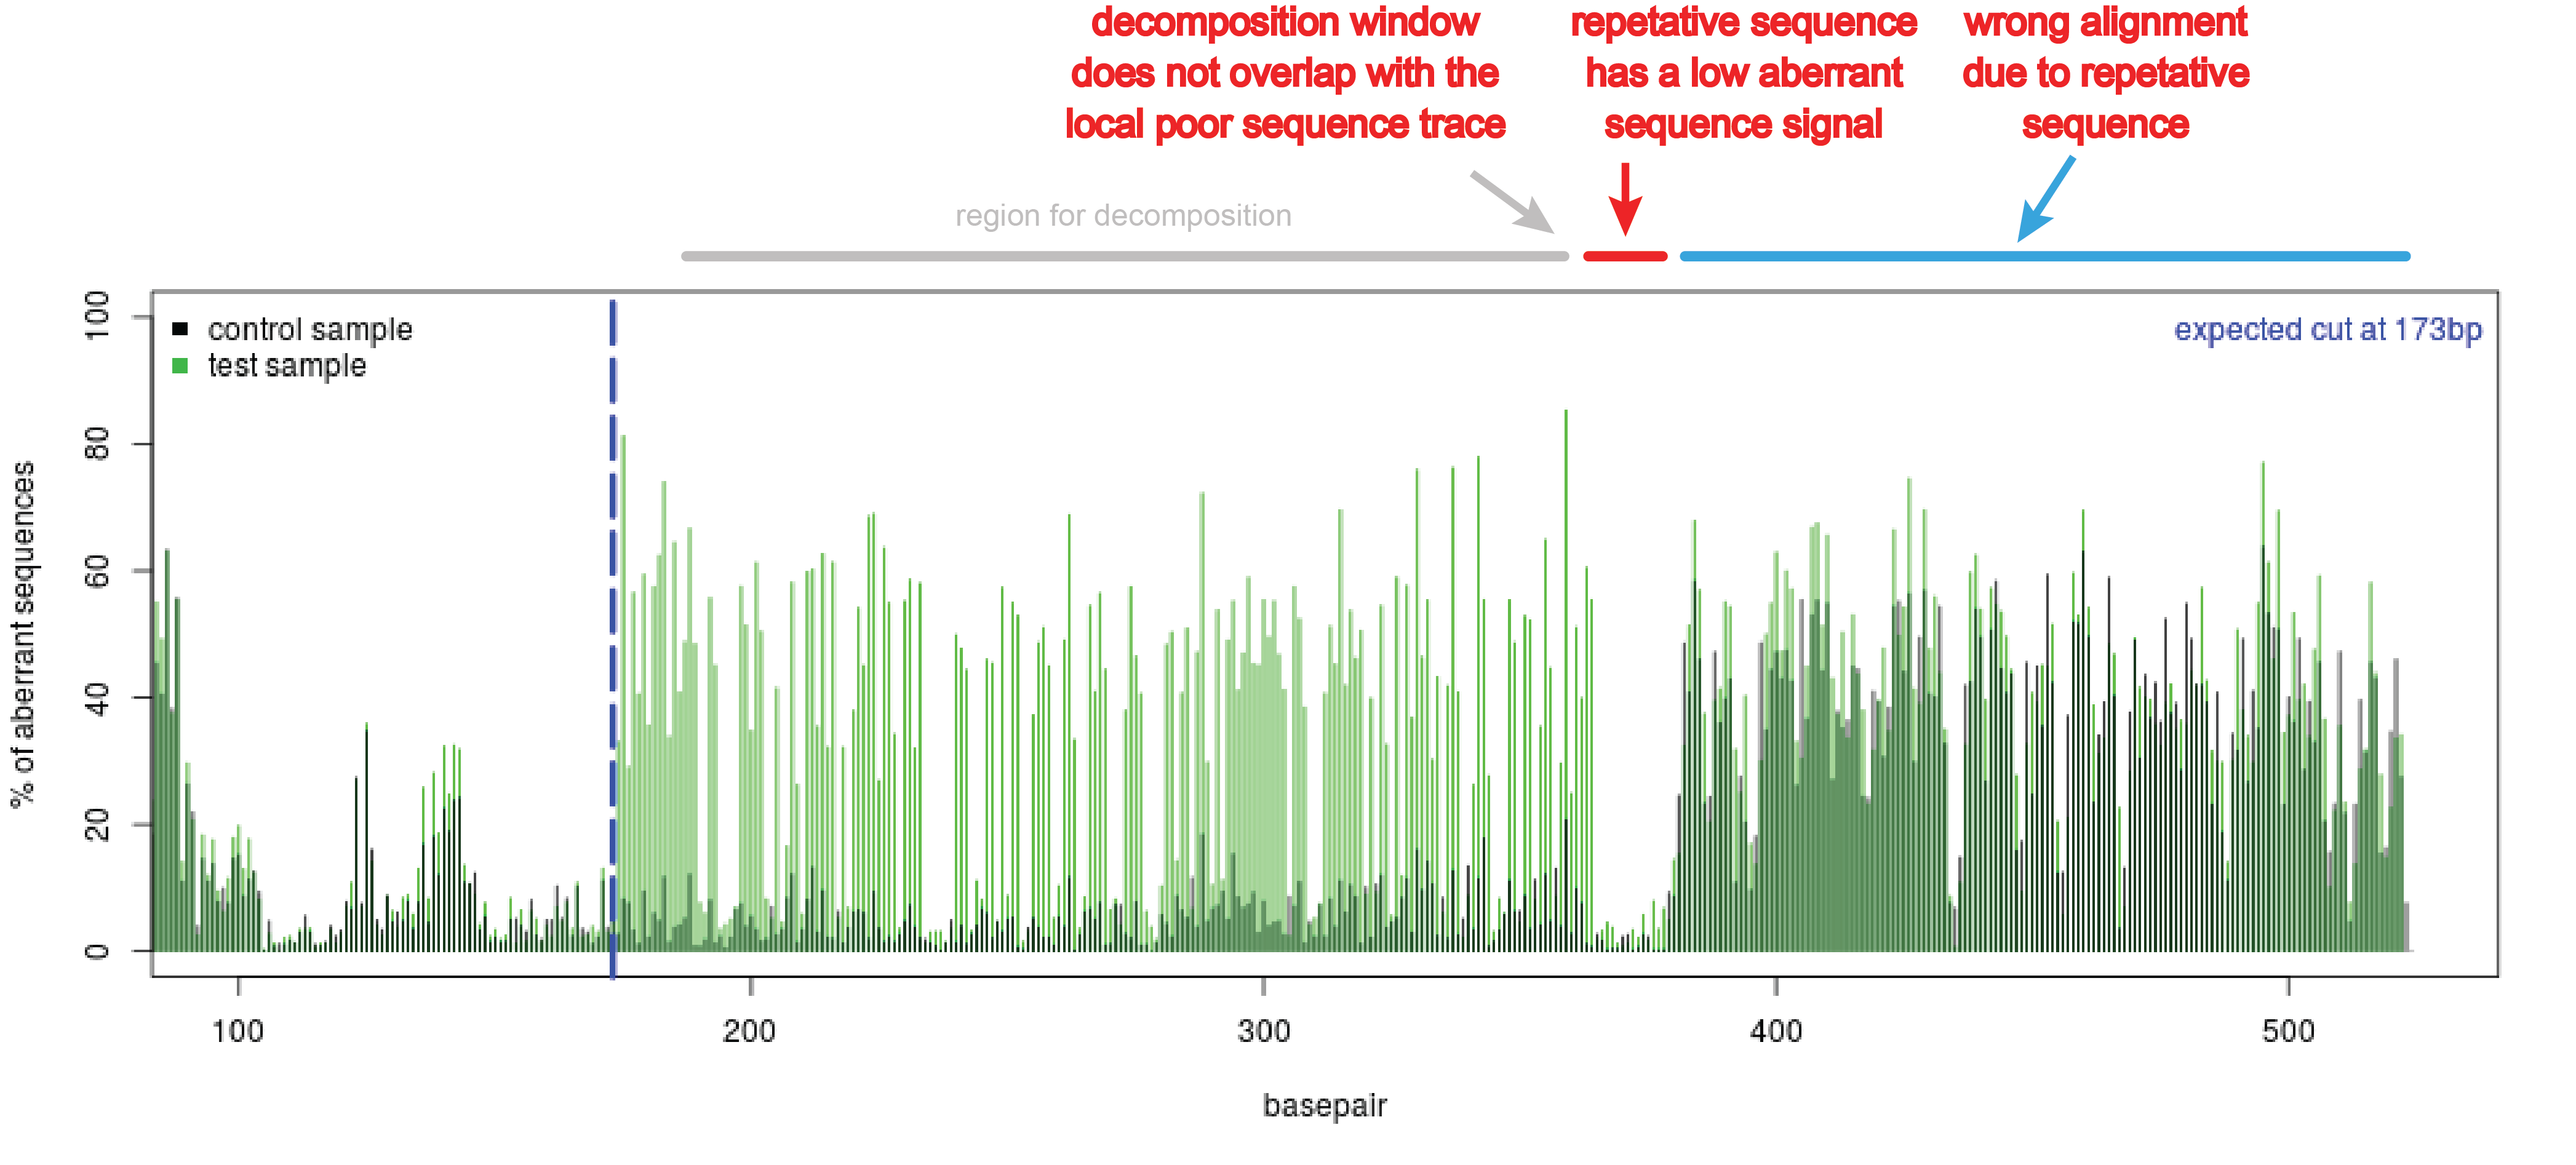
Figure Poor sequence quality
Forward and reverse indel spectra are not identical
If the forward and reverse indel spectra don't give the same indel spectra, one of the results is not reliable. Often there is a misannotation in one of the sequence files (see explanation Wrongly annotated nucleotides).
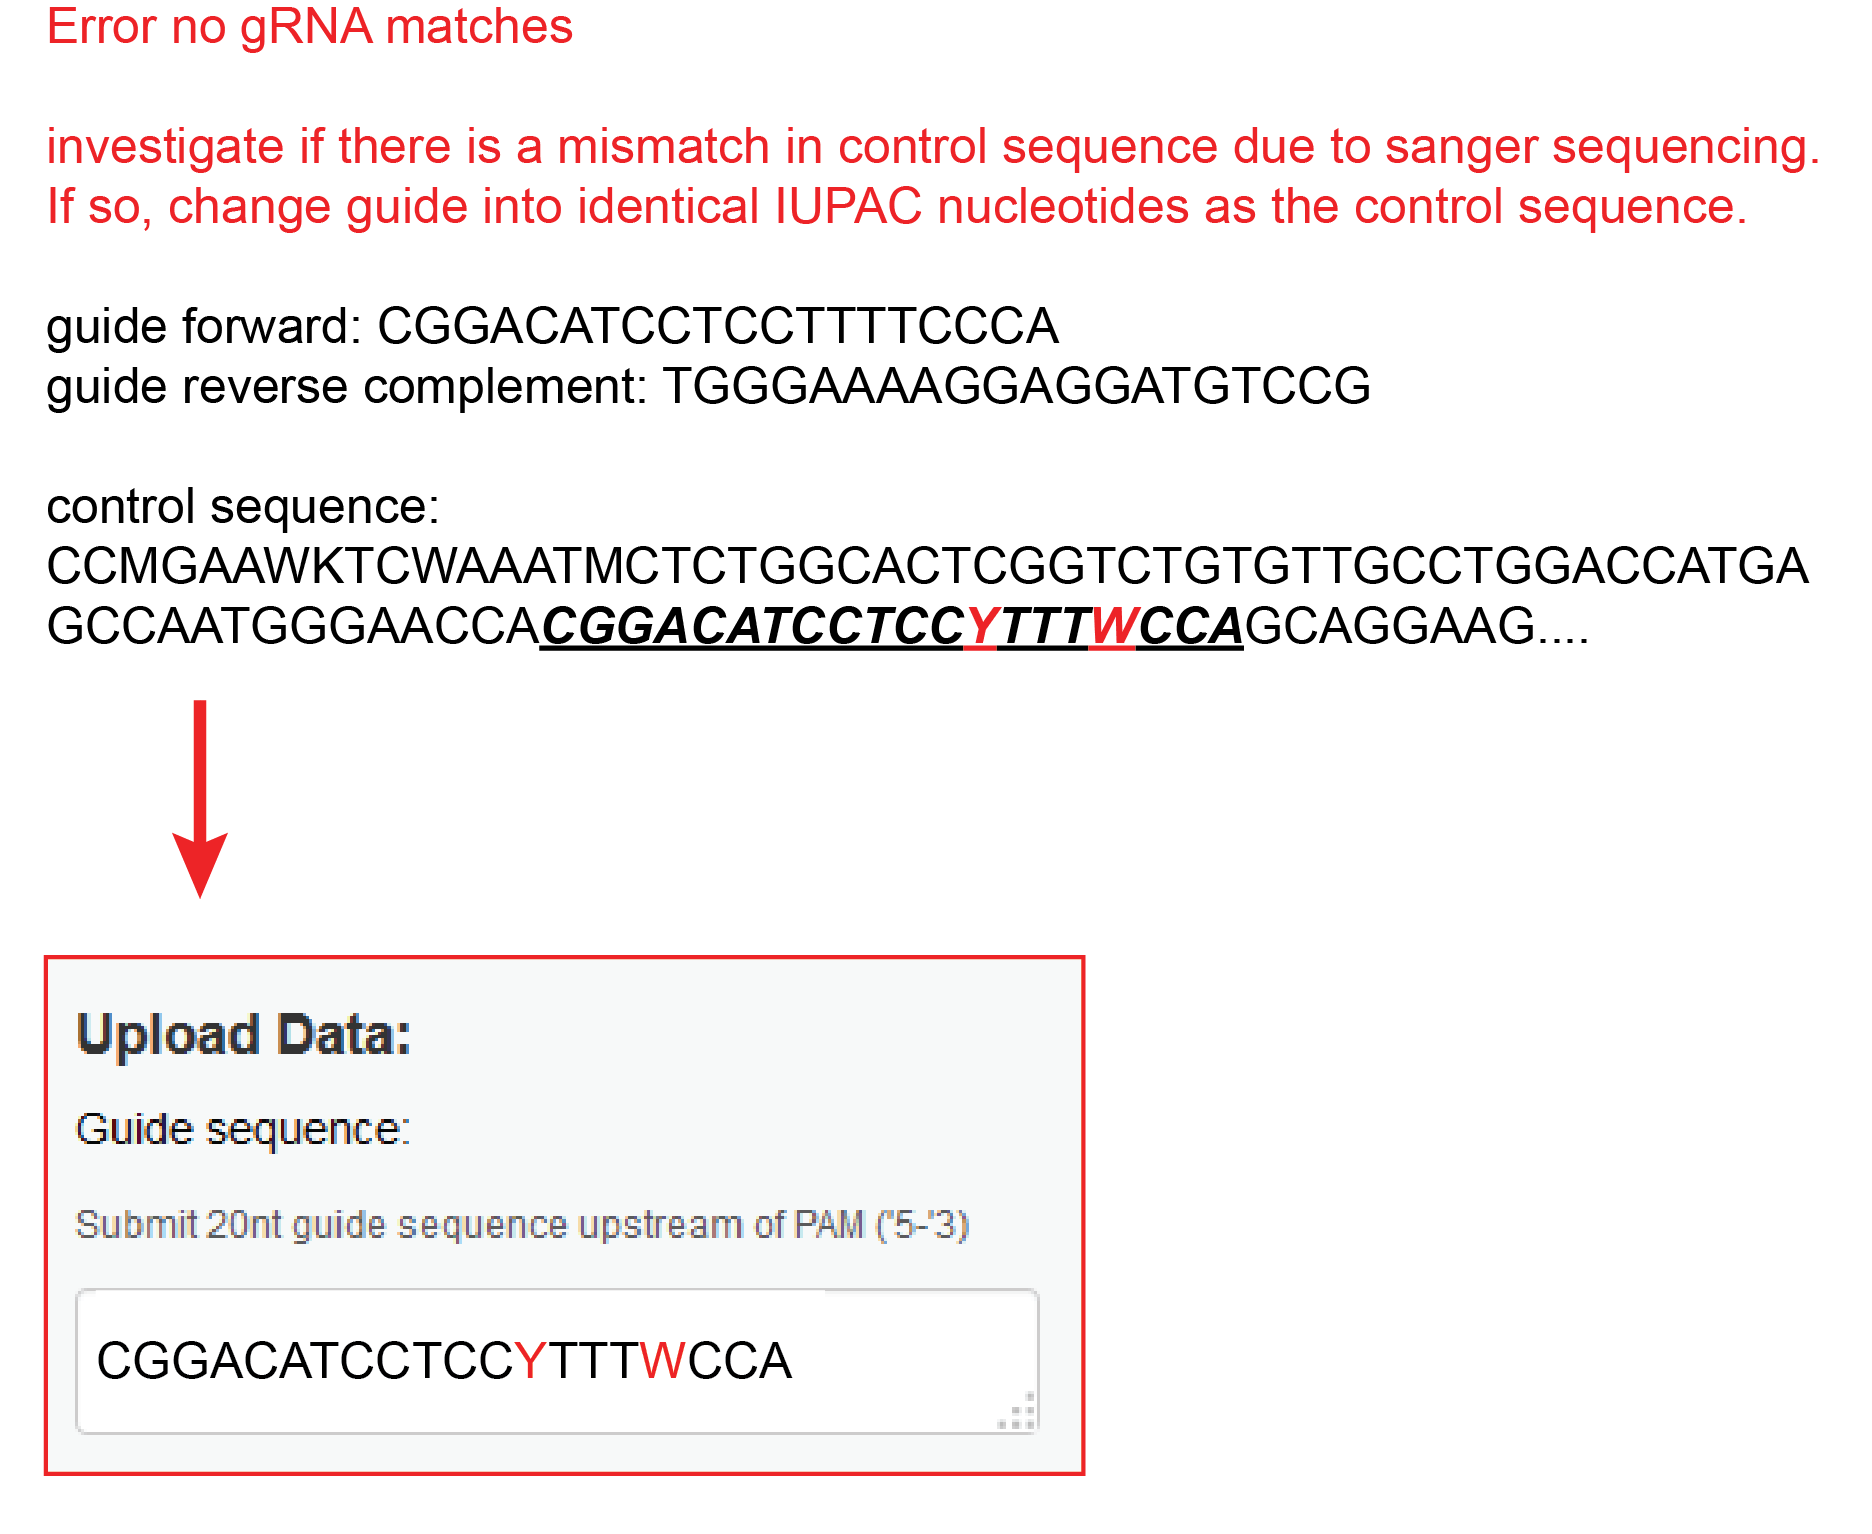
No sgRNA match because there is a mismatch in the control sequence
Sometimes a mismatch occurs in the control sequence at the location of the sgRNA. This will stop the TIDE analysis. In this case, change the guide into identical IUPAC nucleotides as the control sequence.
For example
Error boundaries of decomposed region are not acceptable
With the used settings the decomposition cannot be performed. This can be caused when the settings are not optimal or when the breaksite is too close to the sequence start or end. Try if possible to set decomposition boundaries further apart or use smaller indel size or use lower the alignment window. If that doesn't help you might have to resequence to perform the TIDE analysis. It can also help to sequence the opposite strand. We advise to sequence a stretch of DNA ~700bp enclosing the designed editing site. The projected break site should be located preferably ~200bp downstream from the sequencing start site.
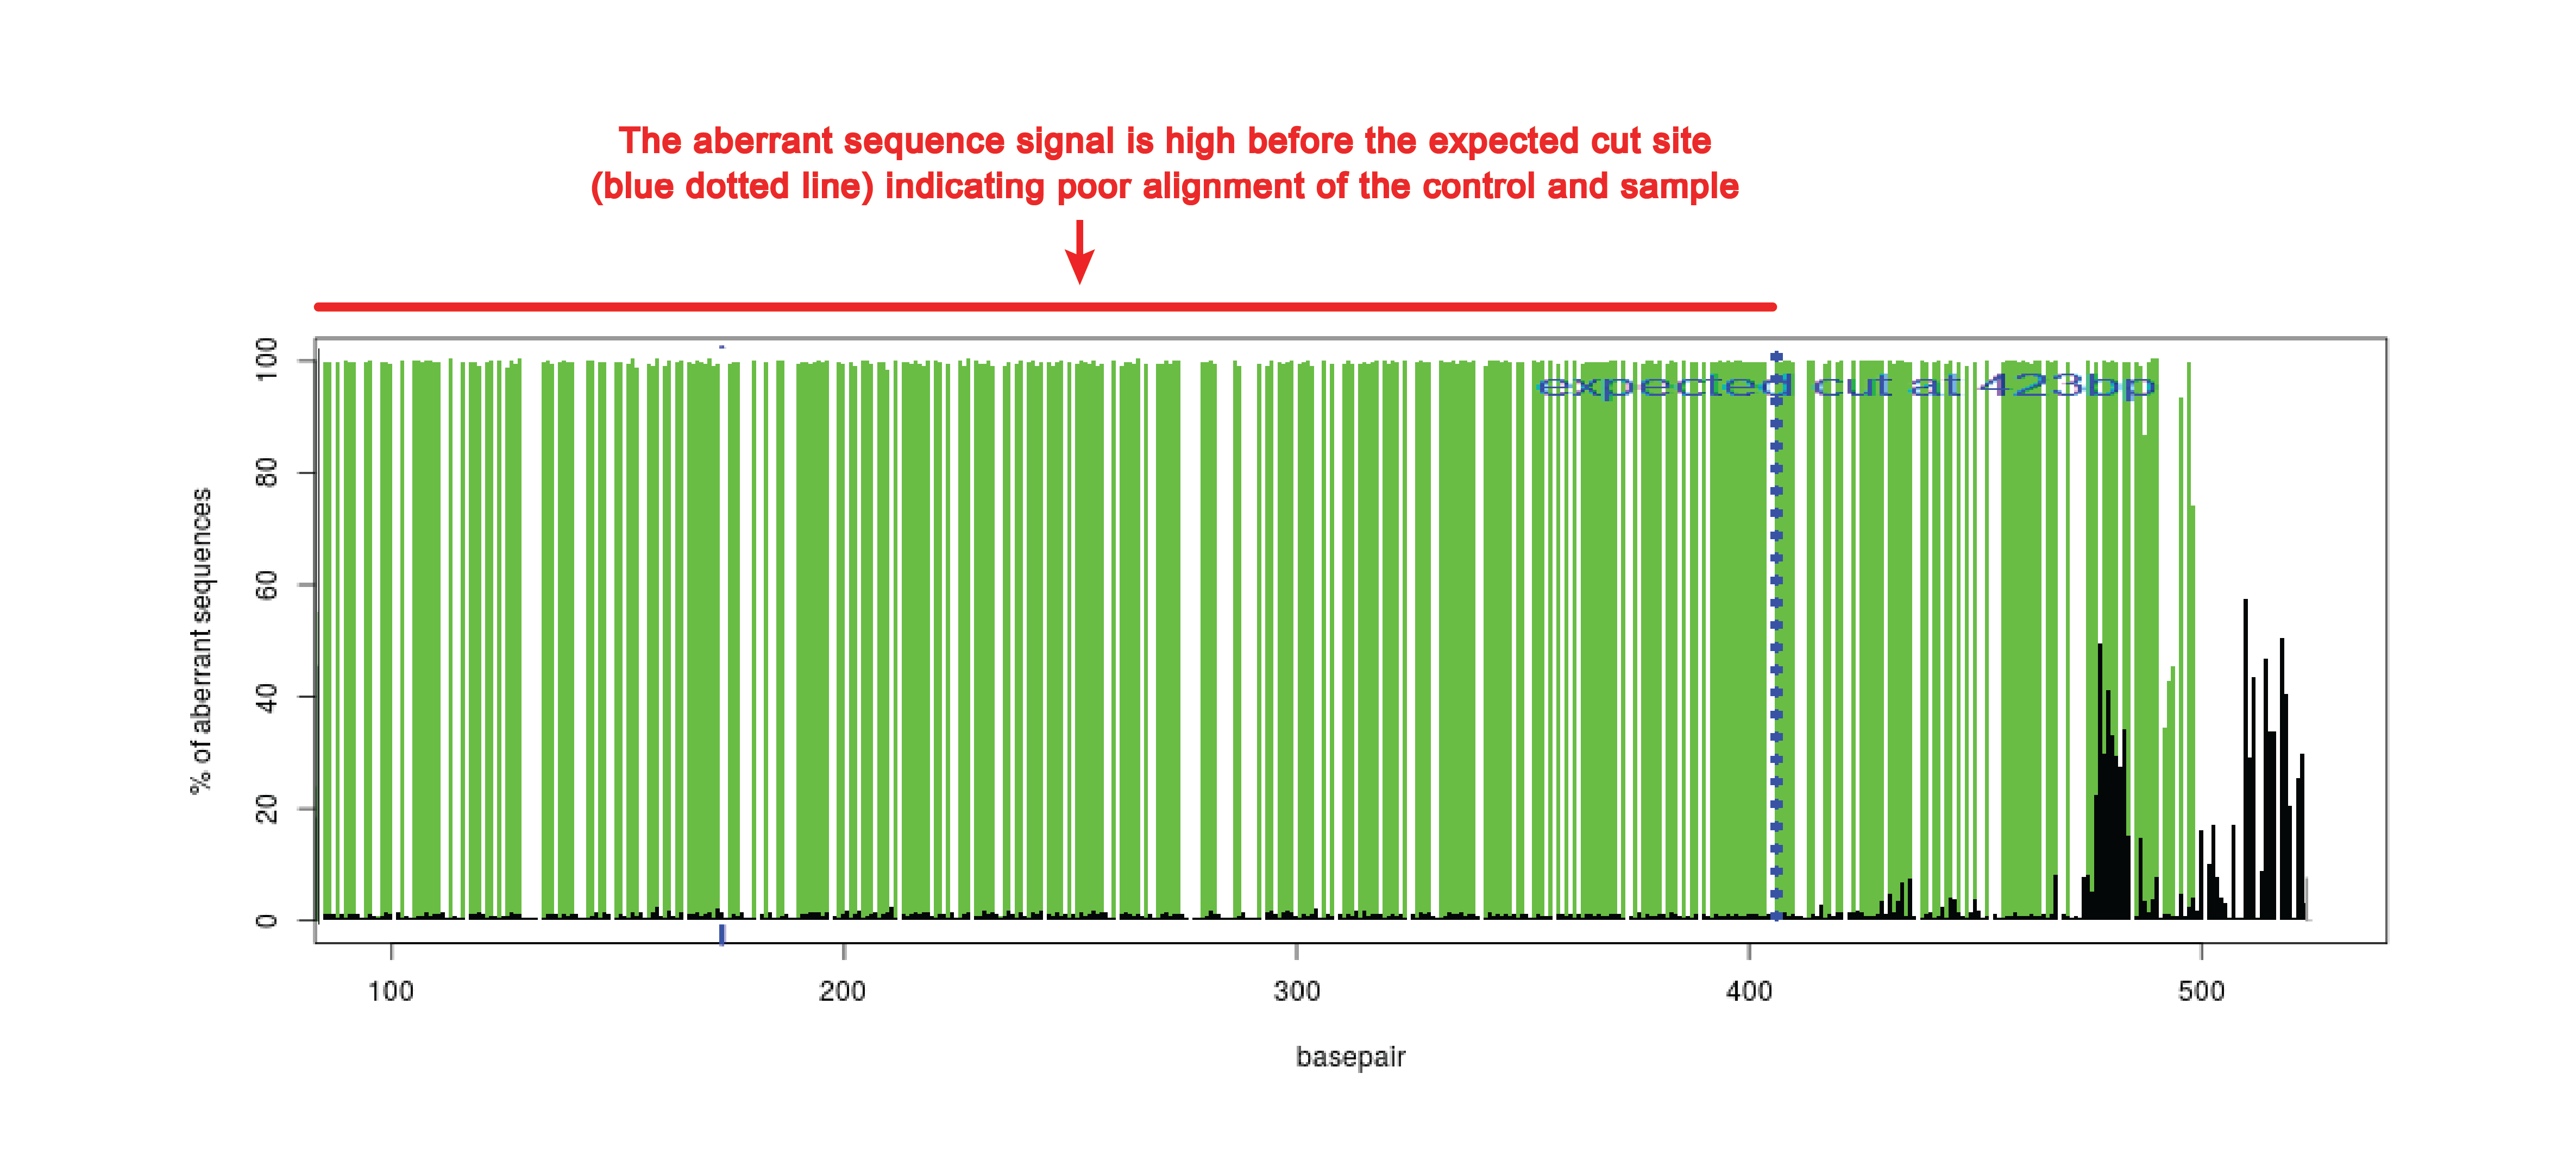
Poor alignment
When the beginning of the sequence is of poor quality, the alignment function can make a mistake. This can be observed in the quality plot that has high aberrant sequence signal over the whole length of the sequence trace (see figure). The aberrant sequence signal should only increase around the expected cut site (blue dotted line).
In case of poor alignment, try to shift the start of sequence read (alignment window) higher or lower. The alignment window can be changed in advance settings.